SLA Dashboard
The SLA Dashboard can be accessed from the tool bar using the ![]() icon. It displays all SLA rules in a Kanban-style layout.
icon. It displays all SLA rules in a Kanban-style layout.
On the dashboard you have an overview over:
- Non confirmed alerts
- Confirm open alerts
- Upcoming deadlines
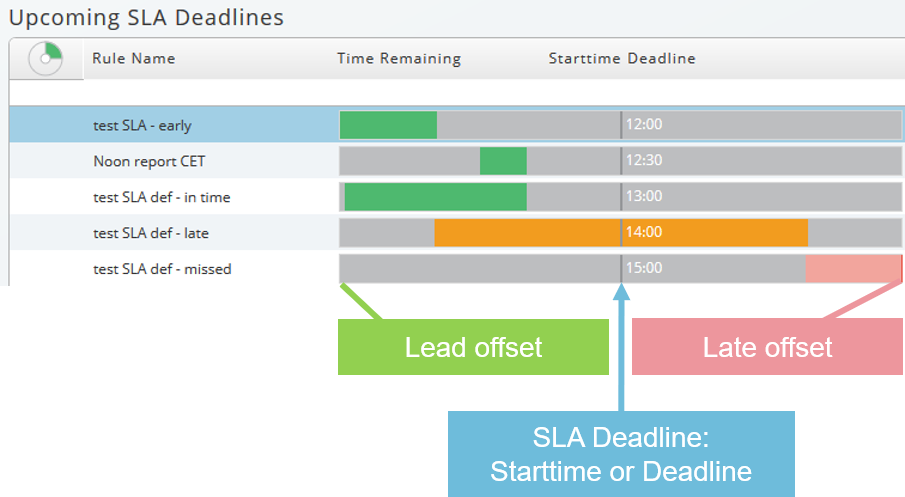
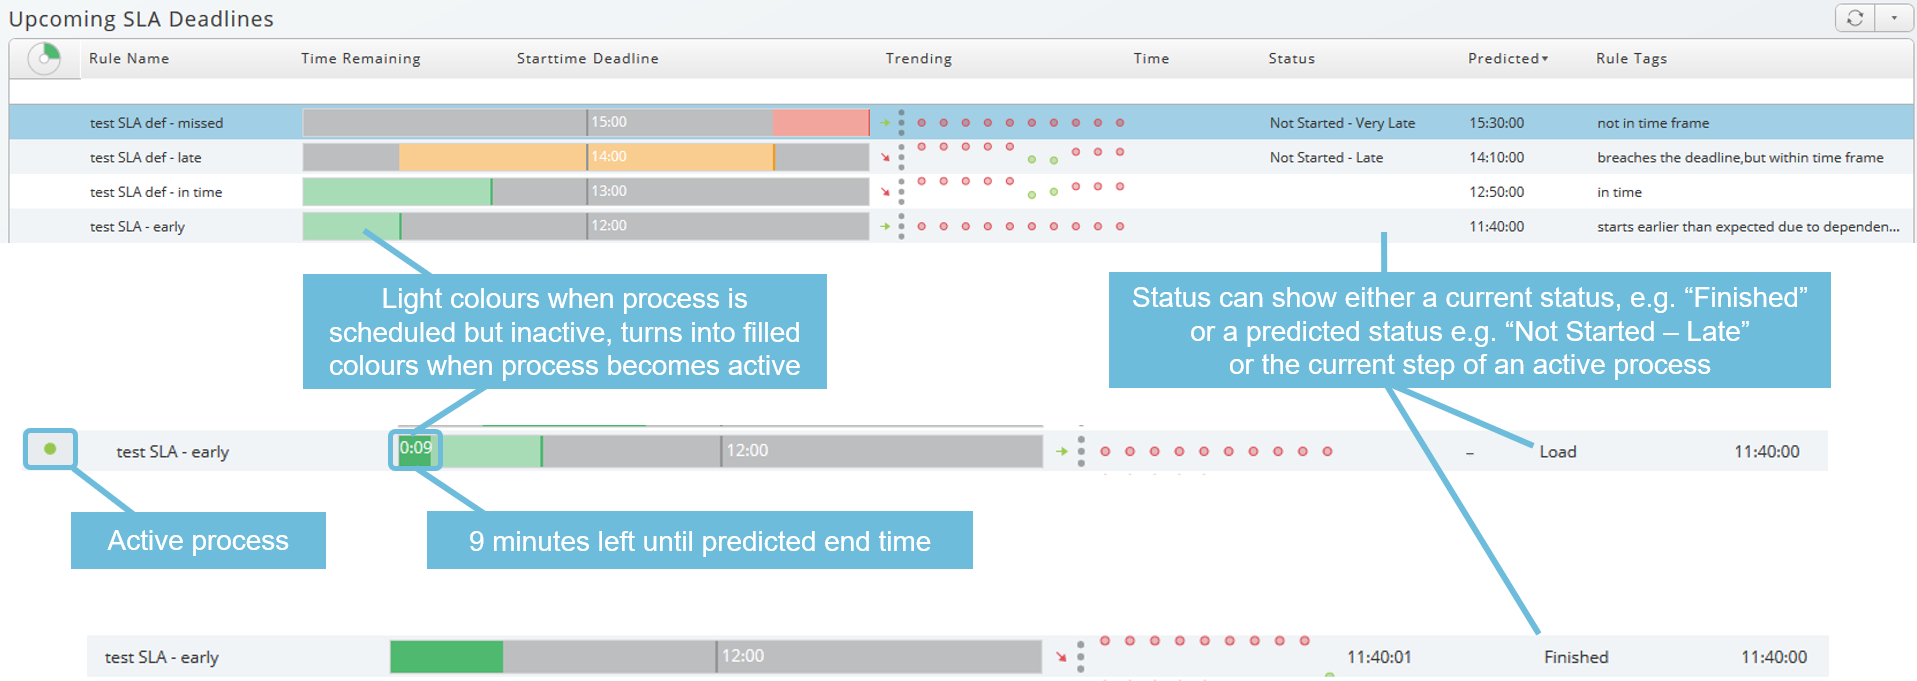
- Show deadline and expected process end times
- Filter rules
- Recent SLA history
- Configure visible history
- Colors indicate predicted and actual statuses according to the SLA
- Light colors show the predicted runtime
- Rich colors show the actual runtime
Kanban Overview

Dashboard Functionality


