Tuning Memory Usage and Garbage Collection
The JVM manages the memory it is allocated by the OS automatically. Once a threshold is reached, the memory consumed by unused objects is freed (deallocated) and made available to the application again. The memory footprint of a JVM running a JEE application server is the combined footprint of the application server and all web applications it is running. Redwood recommends to use a dedicated application server for Redwood Server.
Determining Application Server Base Memory Usage
The JVM gets a certain amount of memory allocated, this memory pool is used by the JVM. You use the following JVM parameters to inspect the allocated memory:
-XMS- the initial amount of memory allocated to the JVM-XMX- the maximum amount of memory that can be allocated to the JVM
The initial amount of memory available to the JVM is XMS. The maximum amount of memory that can be allocated to the JVM is -XMX.
Once you have set up the application server, you can inspect current idle memory usage. Most application servers have built-in tools to inspect the current memory footprint; refer to the application server-related documentation. You can also use tools such as jconsole, which is available in Sun/Oracle, SAP, and HP JVM's; if you use a JVM from a different vendor, refer to the JVM-specific documentation.
note
Inspecting the memory footprint using Task Manager or tools like top will not give you reliable data.
JRockit JVM
The JRockit JVM has not been extensively tested with Redwood Server and Oracle is has implemented most of its advanced features in the 1.8 JVM so Redwood recommends switching to the latest Oracle JVM if you are using JRockit.
Garbage Collection
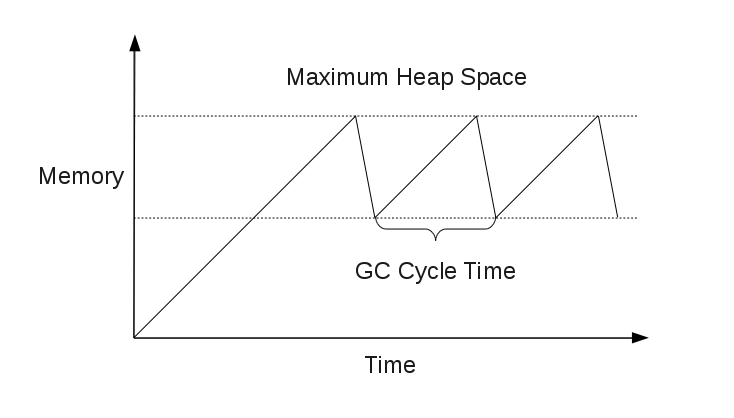
Java uses garbage collection rather than requiring the programmer to free memory explicitly. This means that the amount of memory used will slowly climb until the system detects that it is running low on memory (often triggered by a memory allocation request). At this point the Garbage Collector (GC) runs, and looks around for memory that is allocated but no longer used by the application (called Garbage). It frees some/all of this and then returns the request.
The actual implementation is considerably more sophisticated than is explained here.
Java 11 uses a parallel stop the world collector, the application is stopped while GC runs. This can cause pauses (see below).
The two horizontal lines show the minimum required and maximum used heap sizes. If these are close together, then increasing the maximum heap size will be helpful. If they are too far apart, you may get pauses as large amounts of garbage is collected.

G1 Garbage Collector
The G1 garbage collector allows large heaps with limited GC latency. This means heap sizes of around 6GB or larger, and stable and predictable pause time below 0.5 seconds would benefit greatly from switching to the G1 garbage collector.
You should consider the G1 garbage collector if you experience one or more of the following issues:
- Full GC durations are too long and/or too frequent.
- The rate of object allocation rate or promotion varies significantly.
- Undesired long garbage collection or compaction pauses (longer than 0.5 to 1 second)
You enable the G1 garbage collector using the -XX:+UseG1GC JVM parameter.
Problems and Solutions
If you are getting OutOfMemoryError (OOME) then you need to increase the maximum heap size, simple.
If you are getting long pauses where the application is not responding, GC may be running a long time as it has to do a lot of work. Look at the GC cycle time (see graph above), the amount of memory between the two horizontal lines (or how much churn there is) and the GC log (if you have one) to see if this may be the case. If you are not getting a GC at least once a day, then you may be getting this problem. In this case it may make sense to reduce the maximum amount of memory available, or use GC options to increase the frequency (generally by setting a recommended size for something other than -Xmx ).
If in doubt, and it is possible to increase the amount of memory, take some measurements (a GC log and some timing measurements for performance), increase the amount of memory and take the measurements again. In general Java benefits from more memory allocated.
Getting a GC log
Add the following to the startup (works with the Sun VM and derivatives):
-XX:+PrintGCTimeStamps -XX:+PrintClassHistogram -XX:+PrintGCDetails -verbose:gc -Xloggc:/path/to/gc.log
Once you have reconfigured and restarted NW you can look at the GC log for more information.
Other logs to look for
Generally (it depends on the VM) OOME is logged to stdout or stderr (and thus should be captured to a file).
- On Redwood Platform : Check if
redwood.xml(orscheduler.xmlfor customers who upgraded from 9.1.4 or earlier) containsswallowOutput=true(in which case the output goes to the web app logger), otherwise check wherestderrandstdoutgo. - On other application server: check where
stderrandstdoutgo.
Finally, check for hs_err_pid<xx>.log files. These should be in j2ee/cluster/server<n> but are generally written to the current working directory, which may be somewhere else.
Maximum Heap in 64 and 32-bit Systems
Oracle JVM's and IBM JVM's (some memory regions only, see link below) require one or more (IBM JVM) contiguous blocks of memory
Most platforms now have a 64-bit mode that allows access to more memory. There are some areas to watch out for:
- 32-bit JVM's (generally around 3Gb on UNIX, between 1.2Gb and 1.5Gb on Windows)
Redwood recommends to use a 64-bit system and JVM.
IBM JVM
Oracle and HP JVM's
SAP JVM
Windows Platforms
Memory Limits for Windows Releases
Memory errors during startup
In some cases (for example when far too little memory is allocated) you may not be able to start the application server because of a rogue web application. In this case you need to disable the application.
